A Closer Look at Fault Tree Analysis and how it works

Average reading time is 7 minutes

<A Closer Look at Fault Tree Analysis and how it works>
Investigating a worksite incident – a fatality, injury, illness, or close call – provides employers and workers the opportunity to identify hazards in their operations and shortcomings in their safety and health programs. Most importantly, it enables employers and workers to identify and implement the corrective actions necessary to prevent future incidents. As such it is important that delegates are aware of the various analysis methods available which they can tap on to identify these worksite incidents. We’ll cover one of the many incident investigation techniques – Fault Tree Analysis and how it works.
What is a Fault Tree Analysis (FTA)?
First introduced by Bell Laboratories, the Fault Tree Analysis (FTA) is one of the most widely used methods for investigating worksite incidents and safety analysis. It is a deductive procedure used to determine the various combinations of hardware and software failures and human errors that could cause undesired events at the system level.
The deductive analysis begins with a general conclusion, then attempts to determine the specific causes of the conclusion by constructing a logic diagram called a fault tree. This is also known as taking a top-down approach.
The main purpose of the fault tree analysis is to help identify potential causes of hazardous incidents before the actual incidents occur. It can also be used to evaluate the probability of the top event using analytical or statistical methods.
How Does Fault Tree Analysis (FTA) work?
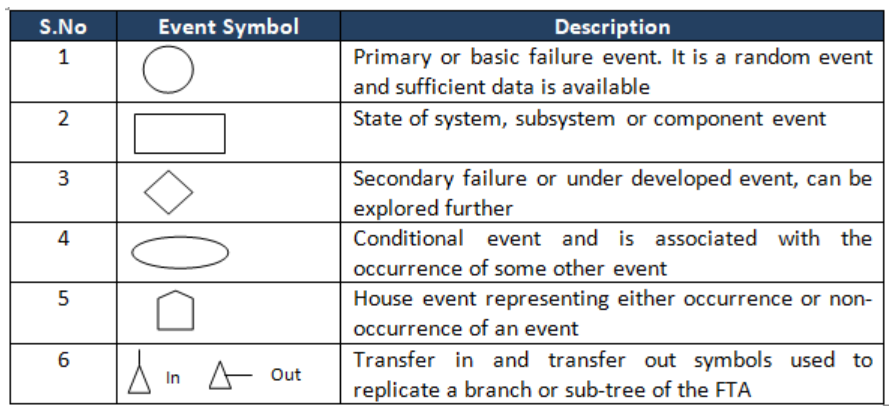
The fault tree is a logic diagram based on the principle of multi-causality, which traces all branches of events which could contribute to an accident or failure. It uses sets of symbols, labels and identifiers which can help in the decoding of the diagram. Even then, there are variations of these symbols in use (Figure 1).

<Figure 1: Examples of the symbols used >
A fault tree diagram is drawn from the top down. The starting point is the undesired event of interest (called the ‘top event’ because it gets placed at the top of the diagram). Users are required to define the primary failure to be analysed or investigated. This process is known as identifying the undesirable top event
Next, users should then logically work out and identify the first level contributory fault conditions which led to that event and are just below the top level using the available technical information. These may each in turn be caused by other faults and so on. It could be an endless process; however, users will naturally have to stop when they get as far as primary failures. The trickiest part of the whole thing is getting the sequence of failure dependencies worked out in the first place.
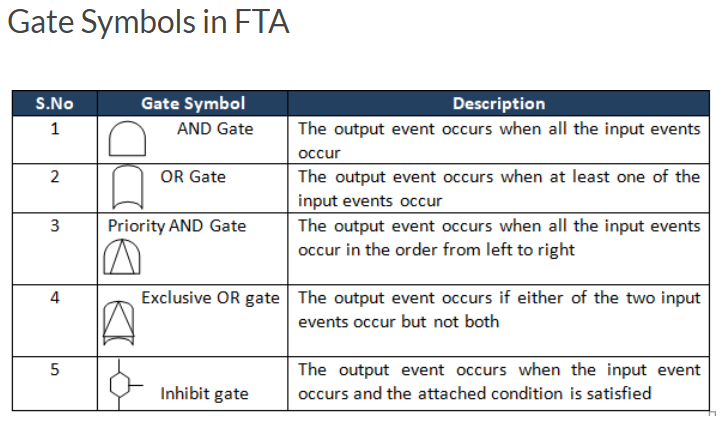
The pathways included in the Fault Tree Diagram analysis connect contributory events and conditions, using standard logic symbols (these symbols stand for either ‘AND’ or ‘OR’). The basic constructs in a fault tree diagram are gates and events, where the events have an identical meaning as a block in an reliability block diagram (RBD) and the gates are the conditions. As such, users are required to link the identified contributors to the top-level event by using these logical gates to observe the relationship between events, which helps in identifying the appropriate logical gate.

<Figure 2: Examples of the Gate symbols used>
Upon determining the connections between contributors and incidents, another important factor present in the qualitative analysis of the fault tree is the identification of minimal cut sets. For instance, complex and large fault tress have to use superior tools (algorithms for extraction) to get the minimal cut sets.
To understand what these cut sets are, a cut set refers to a set of basic events that together cause the top undesirable event. As such, a minimal cut set simply refers to a cut set with minimal number of events that can still cause the top undesirable event. The top undesirable event occurs if one or more minimal cut set occurs.
After which, users can easily review the completed fault tree analysis diagram and evaluate the probability of occurrence for each of the lowest level elements and calculate the statistical probabilities from the bottom up.
To learn more about the various methods of incident investigation and reporting, do heck out the courses that Opus Kinetic has to offer and read our other related blogs below!
Effective Incident Investigation and Reporting is a 3-day online training course that can be conducted in the comfort of your own company’s premises or your own home. Designed to provide participants with a very enriching learning experience and to encourage them to actively participate in the proceedings of the course, the lessons adopt a 2-way communication principle.
The instructional format capitalizes on a careful balance of formal lectures by the trainer and individual / group exercises / workshops.
Unable to make it to the course? Contact us for other available dates.


